

CSG's Market Edge tool, free for New Horizons agents, effortlessly provides carrier heat maps, Medicare enrollment data, agent quoting data, and more.
Here's everything you need to know about using Market Edge to find hidden opportunities in your market.
What Is Market Edge?
Market Edge is a competitive intelligence tool that does four key things:
- Tracks agent quoting activity: over 8 million quotes are run on CSG every year – you can look at this quoting data in Market Edge to see what other agents are doing.
- Track Medicare enrollment data: see how many people are on a Med Supp vs. Med Advantage and use that information to better understand what the market is like in your area.
- Understand Medicare demographics: get a clear picture of how many people are turning 65 in your area versus people who are over age 65 so you can target your marketing appropriately.
- Create carrier heat maps: see a big picture of where carriers are competitive without having to run several quotes.
Related: Insurance Technology: What Modern Insurance Agents Need to Run Their Businesses
How Do I Access Market Edge?
There are two ways to access Market Edge:
- Through MedicareCENTER
- Through the New Horizons quote engine
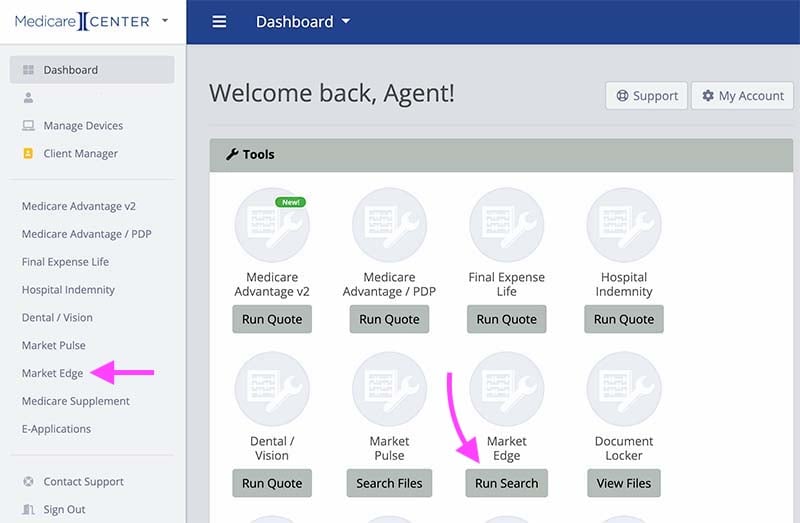
To get into Market Edge from MedicareCENTER, ensure you are registered and signed in. Once you're signed in, click on CSG APP. All of CSG's tools can be found there.
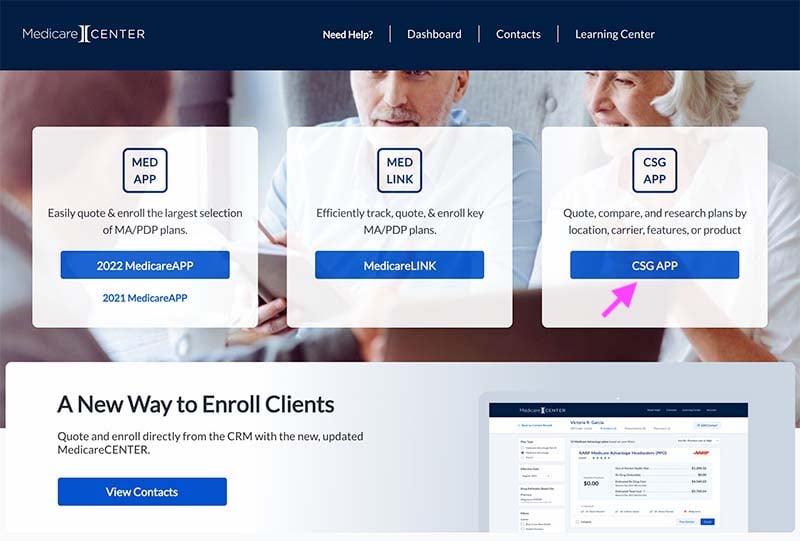
Then, you'll see the CSG dashboard where you can navigate to Market Edge.
Alternatively, you can access Market Edge through the New Horizons quoting tools page. Ensure you are signed into our website and visit the Get Quotes page from our main menu.
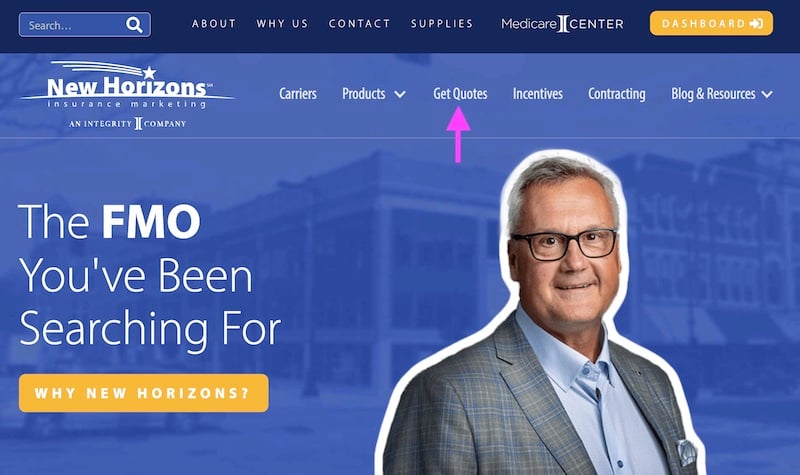
Then, click on Market Edge.
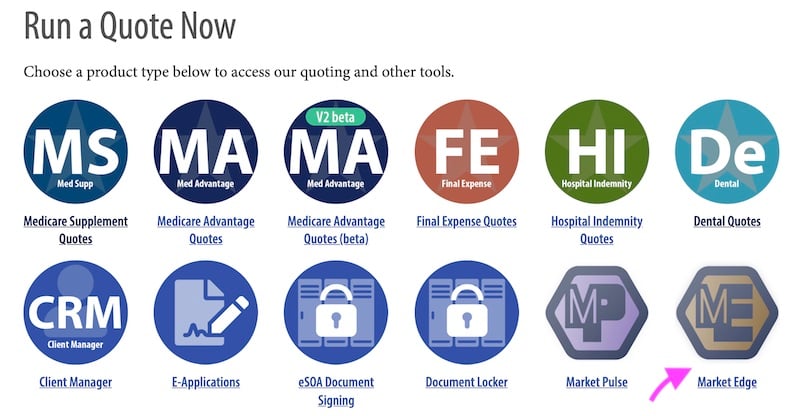
You'll instantly be taken into the Market Edge tool within our CSG quoting system.
How to View Agent Quoting Activity
One functionality within Market Edge is to view agent quoting activity.
CSG is the foremost quoting tool in the senior health insurance industry with over 8 million quotes run every year. That's a lot of data that can help you, the agent!
Using Market Edge, you can see what other agents are quoting, and you can identify quoting trends.
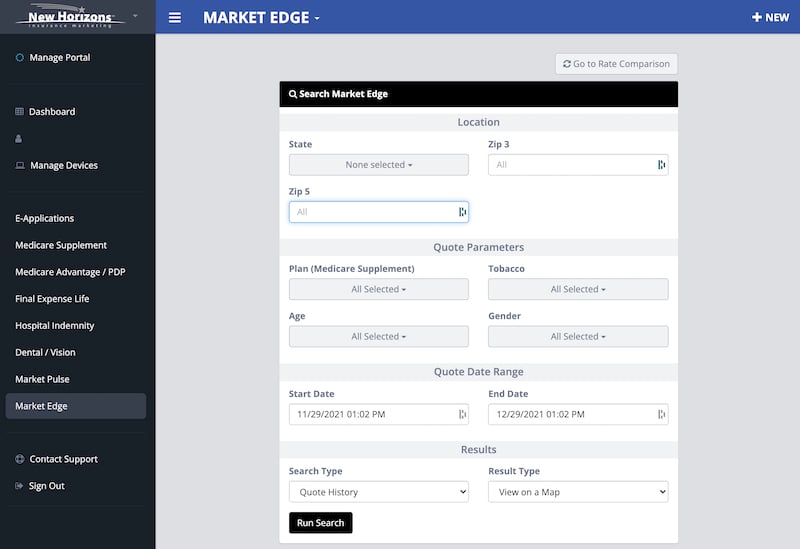
Let's break down agent quoting activity by state and zip code. To start, select your location (State, Zip 3, Zip 5). You can select multiple states if you like.
In the Quote Parameters section, tell the system what quoting activity you want to see.
Let's say I want to know how many Plan F, G, and N quotes were run in Evansville, Indiana (zip codes beginning in 477) during AEP.
Answer: 2,463!
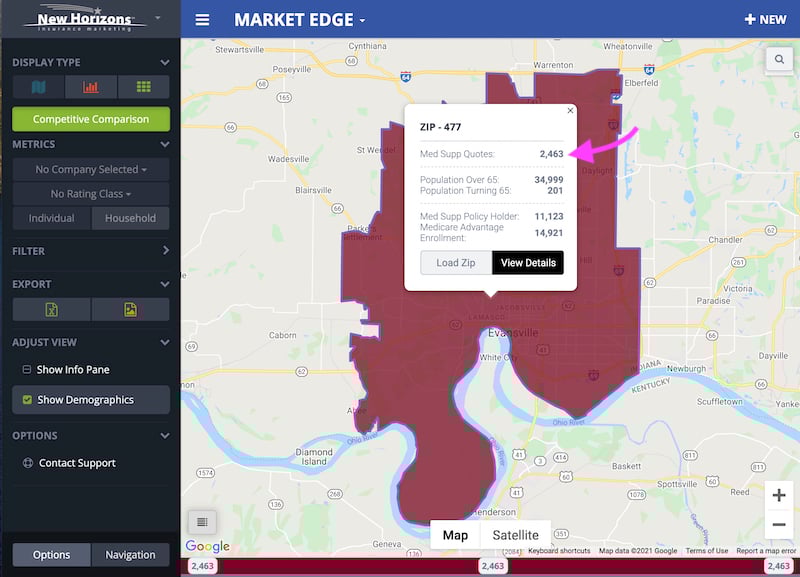
I can even dive into demographic information, but we'll get to that in the next section.
Here is a walkthrough demo so you can visualize how to see agent quoting activity using Market Edge:
How to See Med Supp vs. Med Advantage Enrollment Data
Are you considering expanding into a new state or zip code? It's helpful to understand your market and whether enrollment trends in that location lean toward Medicare Supplements or Medicare Advantage.
You can easily view enrollment data in Market Edge by adding your location.
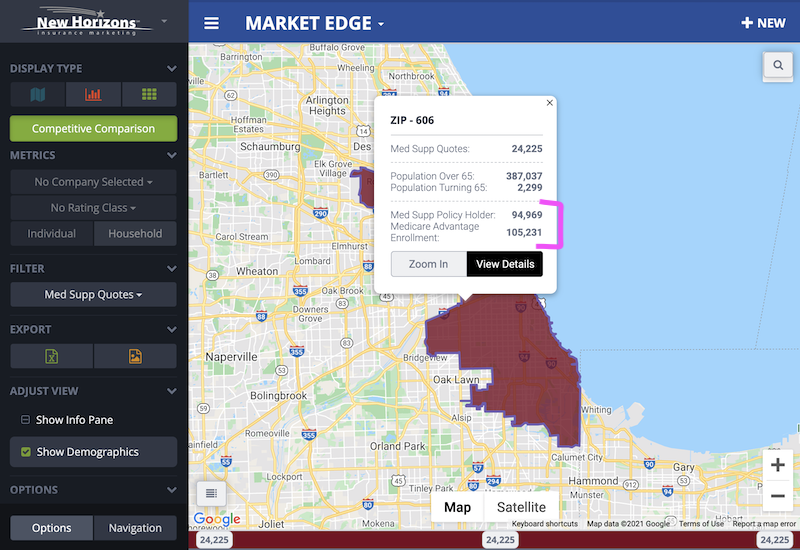
As an example, let's view enrollment data for 606 zip codes (Chicago, IL) from 2021.
I can quickly see that there are 94,969 Med Supp policyholders vs. 105,231 Med Advantage policyholders.
Related Technology Tips: Not Using E-Apps Yet? Here's 9 Reasons Why You Should
How to See T65 vs. Over Age 65 Population Data
View T65 vs. Over Age 65 population data in the same way you view MA vs. Med Supp data. Open Market Edge, and add your location. Run the report, and you can immediately see how many people are over 65 vs. turning 65.
Here's an example of T65 vs. Over 65 data in Waco, Texas from December 10, 2021-January 10, 2022. Wee see that 184 people are turning 65, while over 34,000 individuals are over age 65.
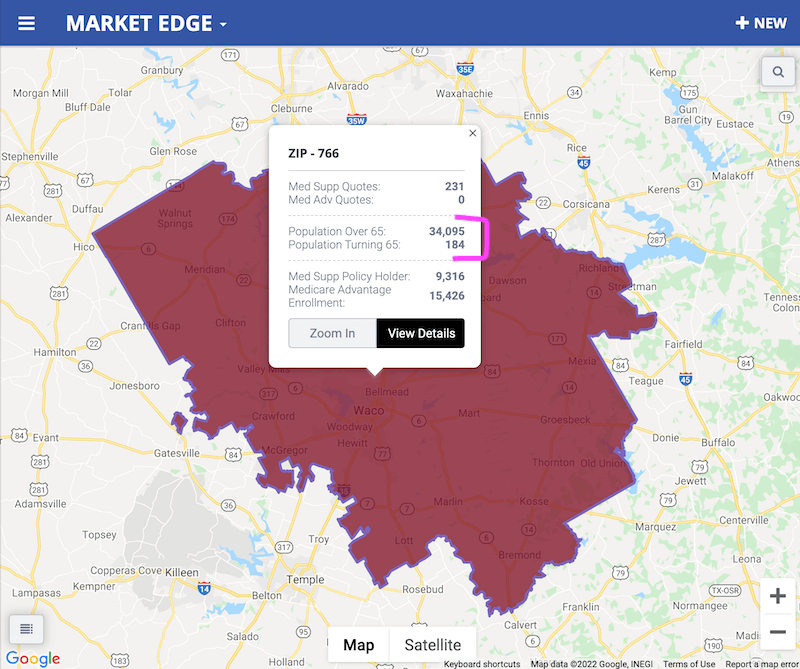
While you cannot get access to individual names or contact information, you can spot trends and adjust your marketing plan according to the opportunity in your area.

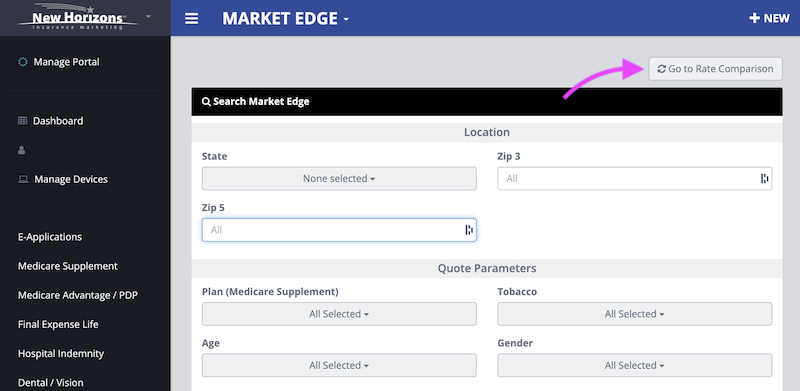
How to Create Carrier Heat Maps
Last but not least, you can create carrier heat maps to find out who is the most competitive in your target markets. This handy feature saves you a lot of time, because you don't have to run multiple quotes!
When you're in Market Edge, click the "Go to Rate Comparison" button at the top right of the screen.
This tool allows you to choose your location and your quote parameters. Then, choose a primary company as well as the company (or companies) you want to compare it against.
See Where a Carrier is Competitive Nationwide
Let's see how competitive American Benefit Life (ABL) is compared to every other Medicare Supplement carrier on the market.
I want to view a nationwide heat map, so I'll select all states and choose my rate parameters (Plan G, Non-tobacco, Age 65, Female).
Select ABL as the Primary Company and "Select All" under Compare Companies.
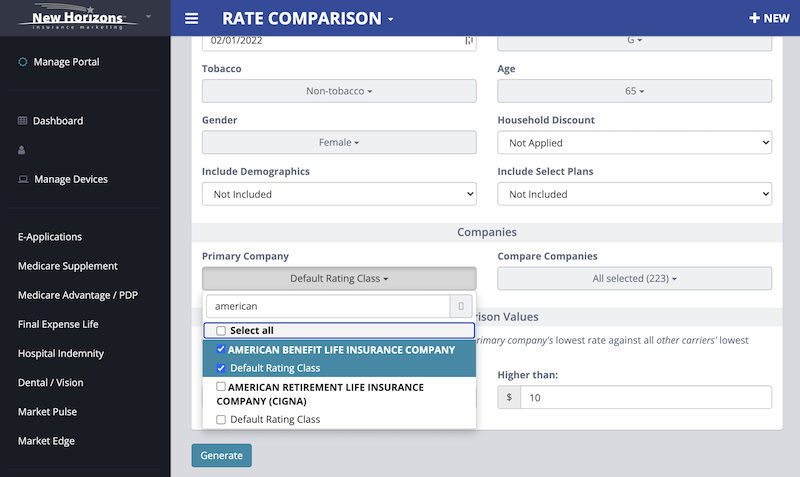
Then, under Comparison Values, set the dollar amount range you'd like to compare the primary company's lowest rate against all other carriers' lowest rates. We'll stick with the default of $5 and $10.
When you're finished adjusting the rate comparison, click "Generate," and the tool will create a competitiveness heat map for you.
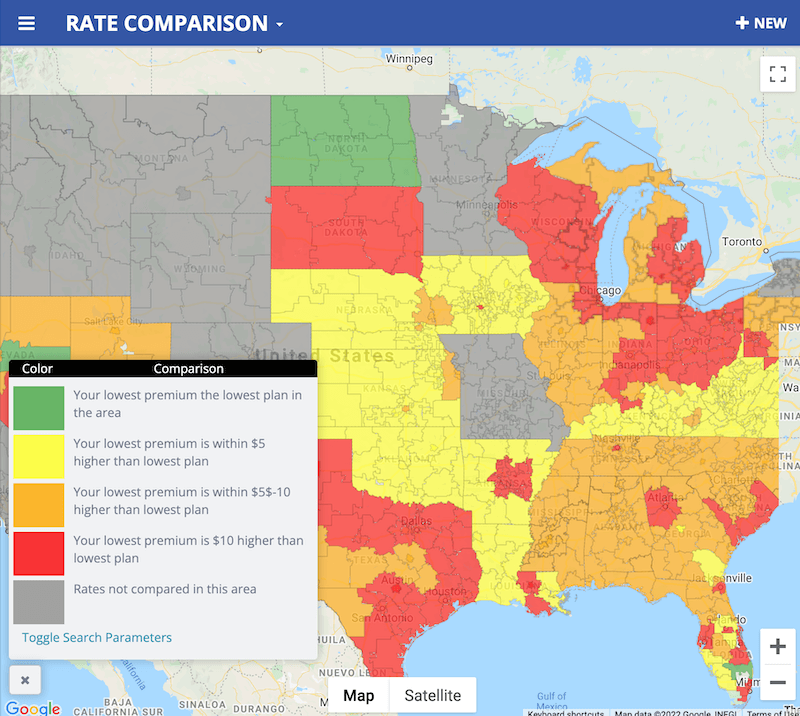
Now, we can see with a quick glance where ABL is most competitive:
- In the "green" areas, ABL is the lowest premium plan available
- In the "yellow" areas, ABL is within $5 of the lowest premium plan
- In the "orange" areas, ABL is within $5-$10 of the lowest premium plan
- In the "red" areas, ABL is $10 or higher compared to the lowest premium plan
Can you imagine running individual quotes for all of these zip codes? Therein lies the power of this heat map tool, especially for agents selling in multiple states.
See If a New Med Supp Carrier Is Competitive
Are you interested in getting contracted with a new Med Supp carrier? Whether they're new to the market or have some great agent perks, such as instant decision underwriting, you need a competitive rate for it to make sense.
Use the Rate Comparison heat map tool to see how their Med Supp rate compares to the lowest premium options in your neck of the woods.
We'll look at the state of Indiana as an example. We'll set our quote parameters (Plan G, Non-Tobacco, Age 65, Female).
We'll use Medico as our example since they came out with a new Medicare Supplement product last year:
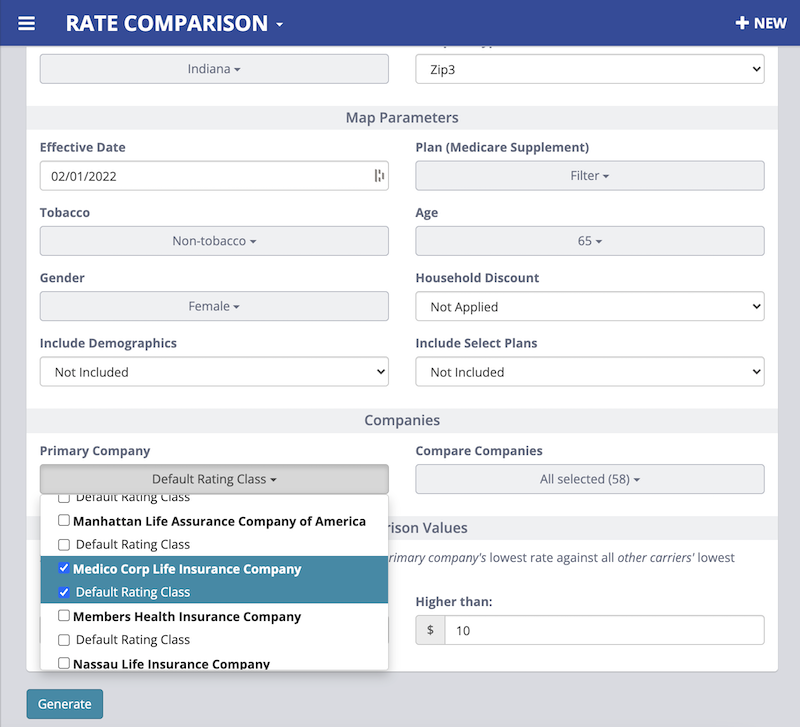
We can see in this heat map that Medico is within $5-$10 of the lowest premium option in several zip codes.
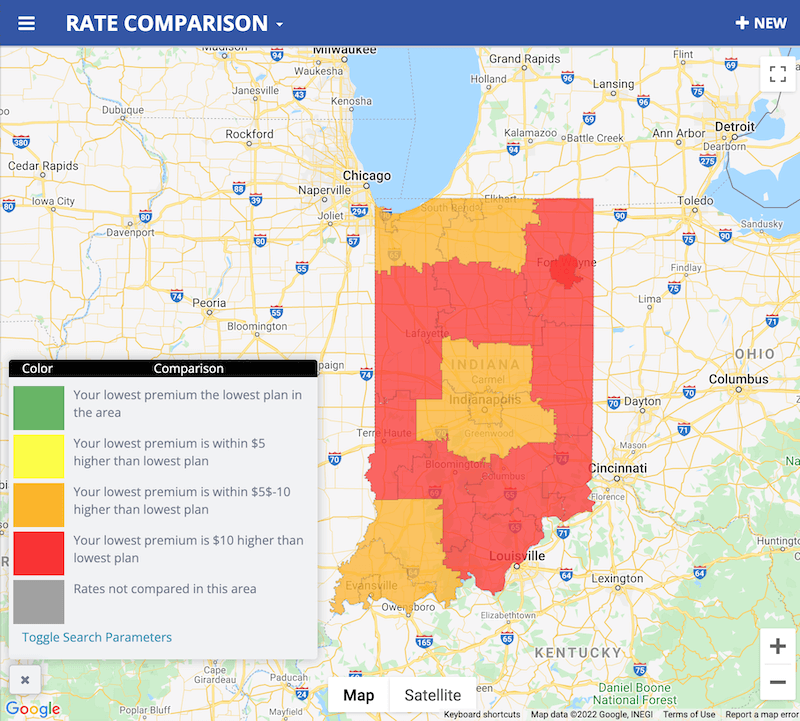
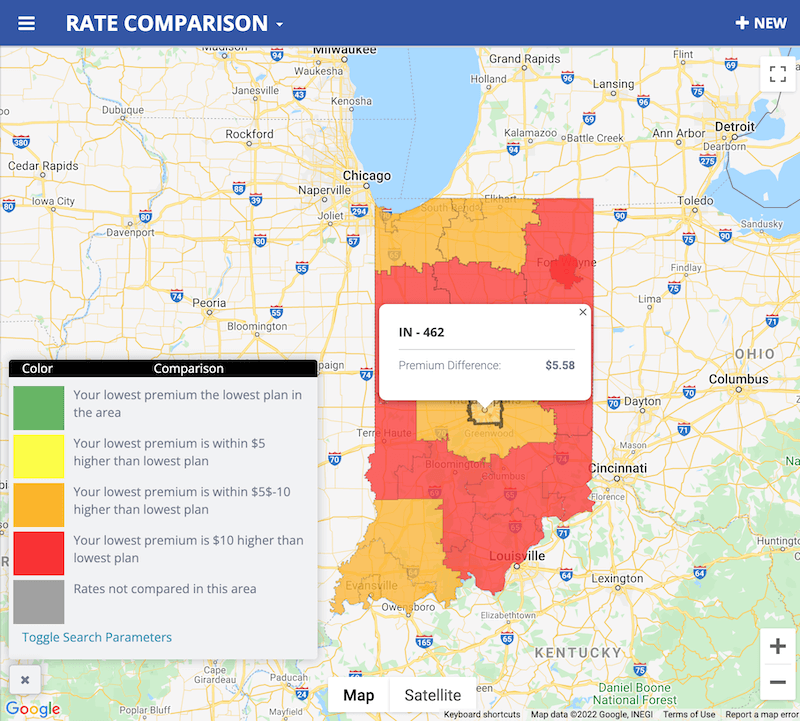
If you hover over a specific area, you can see the exact premium difference.
For example, in zip codes that begin with 462, Medico is $5.58 more than the lowest premium option.
Watch this 2-minute demo for a full walkthrough:
Conclusion
CSG's Market Edge tool is a great way to find hidden opportunities in your market. Just enter your location and uncover Medicare demographic data, the most competitive carriers, and even agent quoting trends.
Remember: if you are a contracted agent with us, access to this tool is completely free! Simply visit MedicareCENTER or our quote engine to get started.
Good selling!


Comments